Savera

Partial findings of the Socio-Economic
& Caste Census (SECC) conducted by the government of India during
2011-12 were released in July this year by the Modi government. The urban
component and the caste component has not been released yet – only the rural
data is available. There has been much confusion about the data because it
seems to be contradictory. ‘Deprivation’ (a euphemism for poverty) appears to
be lower than what other disaggregated data on income of employment shows. The
SECC was the biggest ever exercise of its kind, equivalent to the Census
because it covered the whole population. But it went where Census has hitherto
not gone: incomes, more details of employment, and so on. And its results are
revealing.
The SECC was carried out from June 2011,
after the enumeration work for the main Census was finished. The objectives of
the SECC were: to “rank” households on the basis of their socio-economic
status; to do a caste-wise enumeration; and to make available information about
the socio economic condition and education status of “various castes and
sections of the population”.
Why was it necessary to “rank”
households? Because the policy imperatives of the government drove it towards
targeting its welfare schemes rather than universalizing them, and for
targeting, you need to identify ever lower sections in the economic ladder, who
would receive the benefits. The earlier estimates of poverty had become
embroiled in a shameful controversy since the 1990’s with the Planning
Commission pushing the poverty line lower and lower while the rural development
ministry’s Below Poverty Line (BPL) survey (organized with State governments)
came up with substantially higher results. So, there was a general opinion that
there must be an authentication of numbers.
The caste angle got involved in it
because another weighty issue hanging over successive governments had been of
the Other Backward Castes reservation in government jobs and educational
institutions, currently pegged at 27%. No caste census had been done since 1931
and it was reasonably estimated that OBCs would constitute a much larger proportion
than currently thought. So, it was necessary to settle the matter once and for
all. Once the data on socio-economic conditions was available caste wise, the
vexed issue of who was economically advanced enough to get the benefit of
reservation could also be addressed.
A Flawed Way of
Identifying Deprivation
Identifying Deprivation
The SECC had a complicated methodology
that needs to be understood before the results are studied. Various criteria
were deployed to include, exclude or assess the households. These are:
that needs to be understood before the results are studied. Various criteria
were deployed to include, exclude or assess the households. These are:
1. The Exclusion Criteria: If a household
fulfills any one of the following conditions it will automatically be
considered not deprived: i. Owns motorized 2/3/4 wheeler/fishing boat; ii. Owns
mechanized 3-4 wheeler agricultural equipment; iii. Have Kisan credit card with
credit limit of over Rs. 50,000; iv. Household member government employee; v.
Run a non-agricultural enterprise registered with government; vi. Any member of
household earning more than Rs. 10,000 per month; vii. Paying income tax; viii.
Paying professional tax; ix. Owns 3 or more rooms with pucca walls and roof; x.
Owns refrigerator; xi. Owns landline phone; xii. Owns more than 2.5 acres of
irrigated land with 1 irrigation equipment; xiii. Owns 5 acres or more of
irrigated land for two or more crop season; xiv. Owns at least 7.5 acres of land
or more with at least one irrigation equipment.
2. The Inclusion Criteria #1: After you
remove all the households falling in the above ‘Exclusion’ category, from the
remaining ones, some will get automatically counted as deprived. These are the
ones that fulfill any one of the following five parameters: 1. Households
without shelter; 2. Destitute, living on alms; 3. Manual scavenger families; 4.
Primitive tribal groups; and 5. legally released bonded labour.
3. The Inclusion criteria #2: Of the now
remaining households, any household that meets any one of the following seven
criteria will be considered deprived: 1. Households with one or less room,
kuccha walls and roof; 2. No adult member in household between age 18 and 59
years age; 3. Female headed household with no adult male member between 16 and
59 years age; 4. Households with differently abled member with no other able
bodied adult member; 5. SC/ST Households; 6. Households with no literate adult
above age 25 years; 7. Landless households deriving a major part of their
income from manual labour.
The lacunae in this maze of
exclusion-inclusion parameters are obvious. Are all SC/ST households deprived?
No, because first you will apply the 14 exclusion criteria and those fulfilling
any one of them will get excluded. If a tribal household got a two room pucca
house made with help from some NGO or govt. scheme, they get booted out of the
deprived category. If an SC household got a Kisan credit card or a fisherfolk
family took a loan and got itself a motorized boat (to compete with mechanized
trawlers) then they are out.
It doesn’t matter what your present
income is or how many people are doing what kind of work. Ownership of certain
‘assets’ will disqualify you. As we shall see shortly, these exclusionary
conditions blow up in the face of data collected by the SECC itself.
income is or how many people are doing what kind of work. Ownership of certain
‘assets’ will disqualify you. As we shall see shortly, these exclusionary
conditions blow up in the face of data collected by the SECC itself.
The SECC enumeration continued for two
years mainly because of another methodological feature which distinguished it
from the Census. Information on socio-economic condition for each village was
publicly displayed and people had the right to file objections or changes. Only
after this was it finalized. For the urban areas, this process has yet to be
completed and so, urban data has not been released.
Ironically, the caste part of the SECC
data has also not been released by the government. It appears that this part of
the exercise has collected names of various castes as reported by surveyed
households but as everybody knows, caste names vary from region to region. If
any beginning is to be made at enumerating and categorizing OBCs, a harmonizing
exercise will have to be done throughout the country. That’s a tall order and
the ORGI, which was charged with this part of the task, is reportedly baulking
at the idea. So, the caste data is stuck, along with the urban data.
So, why did the govt. release the rural
data only? Remember the rationale for poverty or deprivation counting? It was
so that welfare schemes could be targeted better. Now, the Modi govt. has
conjured up a whole fairy tale kingdom of ‘Jandhan Yojana’ and Aadhar linking,
and cash transfers and ‘Digital India’ and other trickery. Time is passing fast
and they need to start delivering on something. The Food Security Act is in
abeyance, the loans promised to zero balance account holders are not disbursed.
On the other hand, their compulsion to drive down govt. spending by cutting
down welfare expenditure is meeting with resistance. So, there was need to get
the SECC data out quickly and then base their schemes on it. That is why,
strangely, it was finance minister Arun Jaitely who released the data with the
rural development minister sitting quietly on his side. This is not really
about deprivation and poverty, it is about fiscal policy.
So, here are some of the salient features
of the rural data, released by the govt.
of the rural data, released by the govt.
Out of a total of just over 24 crore
households in the country, about 18 crore live in rural areas, that is, about
73%. All subsequent data pertains to these only.
households in the country, about 18 crore live in rural areas, that is, about
73%. All subsequent data pertains to these only.
The SECC found that 7.05 crore
households, about 39% of all, met any one of the 14 criteria listed above and
hence they were counted as not deprived (which means not poor). Just 16.5 lakh
households –0.92% of all – met the criteria of automatic inclusion.
households, about 39% of all, met any one of the 14 criteria listed above and
hence they were counted as not deprived (which means not poor). Just 16.5 lakh
households –0.92% of all – met the criteria of automatic inclusion.
Of the 10.69 cr eligible households
remaining after automatically excluding ‘not deprived’ ones, about 2 crore
(11.2%) did not report any deprivation. This means that none of the inclusion
criteria #2 were reported by them during the survey. With these eliminations,
8.69 crore (about 49%) of the rural households were discovered to be suffering
deprivation.

Shocking Picture
of Deep Poverty
of Deep Poverty
Contradicting these findings, the SECC’s
own findings on income and asset ownership paint a shocking picture of far more
extensive and multi-dimensional poverty.
own findings on income and asset ownership paint a shocking picture of far more
extensive and multi-dimensional poverty.
In about 74.5% of rural households the
income of the main breadwinner is less than Rs.5000 per month. That’s about
13.34 crore households out of total 17.9 crore rural households. In another
3.08 crore households or about 17% of the total, the main breadwinner had
incomes between Rs.5000 and Rs.10,000. Adding these two up – in some 92% rural
households, the highest earner is getting not more than Rs.10,000 per month.

What is this ‘highest earner’ or ‘main
bread winner’ business? This is a peculiarity that the SECC inflicted upon
itself by asking the question in this way instead of asking for the family’s
income. Perhaps they thought that this would reflect – more or less – the large
chunk of family income. If that was the case then they would largely be right.
Women’s incomes (visible or accounted ones) are as a norm quite low, if any. So
chances of household incomes being very substantially different from the main
bread winners’ incomes are low. In any case the proportions are staggering. So,
even if a Rs.5000 main income household earns another (say) Rs.3000 through
subsidiary work by a woman member, they would still be below Rs.10,000.
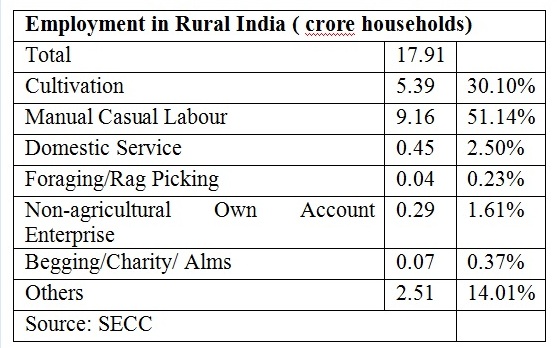
There are other indicators of the
staggering depth of poverty. Over 51% of households are dependent on manual
casual labour for livelihood. Note that the work they do is ‘manual’ which
means backbreaking work ranging from women transplanting rice to families
making clay bricks to labour gangs making roads and bridges to migrant labour
cutting sugarcane and so on. Note also that this is ‘casual’ labour – that
means it is not regular, there is no security, no supportive benefits, outside
the pale of labour law protection and definitely very low paid. Also, it means
that work is sometimes available sometimes not.
Over 10 crore households – 56% of all –
have no land. In Bihar and Punjab this figure
goes up to 65%. In West Bengal it is 70%, in
Kerala it is 72%, and in Andhra Pradesh and Tamil Nadu, it is 73%. This
information on its own indicates the deep deprivation suffered by the mass of
rural households.
have no land. In Bihar and Punjab this figure
goes up to 65%. In West Bengal it is 70%, in
Kerala it is 72%, and in Andhra Pradesh and Tamil Nadu, it is 73%. This
information on its own indicates the deep deprivation suffered by the mass of
rural households.
Just 37% of cultivated land have assured
irrigation facilities for two crops. About 40% has no irrigation facilities (it
is rain fed) while another 23% has some uncertain facilities. Just about 10% of
households own irrigation equipment – pump sets, drip or sprinkler systems etc.
These are in all probability the otherwise propertied and richer sections and
they would be selling water to all the others deprived sections.
In case you think that many landless and
other poor sections might be working in some kind of non-agricultural
enterprises or salaried jobs, think again. Just 2.7% households were associated
with any non-agricultural registered enterprises. Just over 6% households had
members employed in govt. or public sector jobs and just 3.6% households had a
member working in a private sector establishment paying salary.
Nearly 70% rural households live in one
or two room houses. 45% stay in kuchcha houses, built of mud, thatch, stone,
wood or plastic.
or two room houses. 45% stay in kuchcha houses, built of mud, thatch, stone,
wood or plastic.
Put all these fragments together and a
horrifying picture of the real India
emerges. It is difficult to see find this India when Narendra Modi is giving
speeches in Madison Square Garden in New York, or Beijing, recounting his
dreams of smart cities, bullet trains, paperless digital governance, and so on.
horrifying picture of the real India
emerges. It is difficult to see find this India when Narendra Modi is giving
speeches in Madison Square Garden in New York, or Beijing, recounting his
dreams of smart cities, bullet trains, paperless digital governance, and so on.
What this data also does is demolish the
‘deprivation criteria’ based figures worked out by the SECC for the purpose of
enumerating poverty stricken households. Against a 49% deprived rural
households identified by the deprivation criteria, we have over 92% of the
rural households with less than Rs.10,000 monthly income of the highest bread
winner. Clearly, the govt. is set to use the limited figure to unroll its
schemes – that will suit its perspective of cutting down welfare expenditure
and subsidies.
The SECC data on employment and incomes
shows glimpses of the deep agrarian crisis in India. Over half the rural
population is earning its livelihood through manual labour, while just a third
is actually involved in cultivation. A small fraction is working in salaried
jobs, that too with the government footing the bill. The depth of income
poverty is staggering. Successive NSSO reports have indicated this fact but
apologists for the neoliberal policies have been refusing to accept this. Urban
data is not out but it will bring to light other dimensions – growing urban
poverty as also growing inequality. After 25 years of grinding down the people
with neoliberal policy prescriptions, this shows the spectacular failure of
such policies.
The author works for a prominent daily newspaper